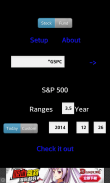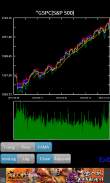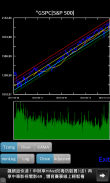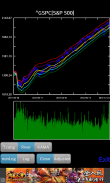


Finance Conduit (Stock/Fund)

Description of Finance Conduit (Stock/Fund)
ফাইন্যান্স কনডুইট তজং এর কনডুইট ভিত্তিক। তেজগাঁও কনডুইট উত্থাপন করেন ড। আপনি তার ওয়েবসাইটে তার তত্ত্ব সম্পর্কে আরও পড়তে পারেন: http://www.ycchan.net/theory.aspx।
ঐতিহাসিক মূল্যের প্রবণতার উপর ভিত্তি করে দাম বাড়ার বা ডাউন হওয়ার সম্ভাব্যতা যাচাই করার লক্ষ্যে তজং এর কনডুইট একটি উদ্দেশ্যমূলক উপায় সরবরাহ করে।
কউফম্যান অ্যাডাপ্টিভ মুভিং এভারেজটি পেরি জে। কাউফম্যান দ্বারা তৈরি করা হয়েছিল। আপনি http://fxcodebase.com/wiki/index.php/Kaufman's_Adaptive_Moving_Average_(KAMA) এ আরও তথ্য পেতে পারেন।
হায়াশির নরিয়াকি বিক্রিয়ার চাপ অনুপাত (এসপিআর) তৈরি করেছিলেন। আমি একটি ইংরেজি ওয়েবসাইট এটি বর্ণনা করতে পারছি না কিন্তু এটি মানি ফ্লো ইন্ডেক্স (http://en.wikipedia.org/wiki/Money_flow_index) এর মতো।
প্রাইস হেডলি দ্বারা অ্যাক্সিলেশন ব্যান্ড পাওয়া যায়, আপনি তার বই (ট্রেডিংয়ের বড় প্রবণতা) বা তার ওয়েবসাইটে (http://www.bigtrends.com/price-headley/) আরও তথ্য পেতে পারেন। এখানে আমরা গণনার জন্য এটির সময় হিসাবে SPR সময়কাল ব্যবহার করি।
মান্সফিল্ড রিল্যাটিভ স্ট্রেংথ সূচকটি ওজনযুক্ত সূচকের সাথে স্টক মূল্যের তুলনা করার জন্য ব্যবহৃত হয়। মানটি ইতিবাচক হলে, এটি ওজনযুক্ত সূচকের চেয়ে শক্তিশালী, অন্যথায় এটি দুর্বল। বর্তমানে টিএইচআইআই এবং মেইনল্যান্ড চীন এর স্টক (.ss) এর সাথে তাইওয়ান স্টকগুলি (.tw / .two) এর সাথে তুলনা করছে 000001.ss এবং হংকং (.hk) স্টক সহ ^ এইচএসআই এবং ইংল্যান্ড স্টক (.l) সহ ↑ FTSE এবং জার্মান ↑ জিডিএক্সএক্সআই এবং ফ্রান্স স্টক (। ডি) এর সাথে ^ ^ জিএসিএক্সআই এবং ফ্রান্স স্টক (। পিপি) ^ ^ কেএস 11 সহ কোরিয়ান স্টক এবং কোরিয়ান স্টকগুলি সহ, অন্য সবগুলি এস & পি 500 (^ জিএসপিসি) এর সাথে তুলনা করে, যদি এটি জিএসপিসি +5 দেখায়, এর মানে হল এটি 5 এর জন্য S & P500 এর চেয়ে শক্তিশালী। দিন। আপনি এখানে এটির অ্যালগরিদমটি খুঁজে পেতে পারেন (http://stageanalysis.net/reference/how-to-create-the-mansfield-relative-strength-indicator/558)।
বিগ ভলিউম স্ক্যানটি সনাক্ত করা হয় যে গড় সময়ের ভলিউম আগের তুলনা সময়ের চেয়ে বেশি কিনা 'গড় গুণককে গুণান্বিত করে এবং শেষ বন্ধের মূল্য SMA মানের থেকে বেশি। যদি সনাক্ত করা হয়, এটি BV দেখাবে। এছাড়াও যদি শেষ বাণিজ্য তারিখের দাম SMA মানের থেকে বেশি হয় তবে এটি XMA এর জন্য কমপক্ষে SMA + x, x দিনগুলির জন্য বড় অর্থ বা SMA-x দেখাবে।
অন্য রেফারেন্স ওয়েবসাইট:
1. http://allanlin998.blogspot.tw
2. https://www.facebook.com/groups/alpha168/
3.http: //freenenjoy.blogspot.tw/2013/08/blog-post.html
স্টক তথ্য ইয়াহু ফাইন্যান্স থেকে উদ্ধার করা হয় (http://finance.yahoo.com)।
ইয়াহু মানি থেকে ফান্ড তথ্য উদ্ধার করা হয় (https://tw.money.yahoo.com)।
Google তথ্যটি Google ফাইন্যান্স থেকে পুনরুদ্ধার করা হয়েছে (https://www.google.com/finance)।
দাবি পরিত্যাগী:
ফাইন্যান্স কনডুইট শুধুমাত্র দামের প্রবণতা দেখায় এবং এটি কেবল আপনার রেফারেন্সের জন্য। এটা কিছু জন্য নিশ্চিত করা হয় না। ফাইন্যান্স কনডুইট আপনার নিজের রায় দিয়ে আপনি যে কোনও ক্ষতির জন্য দায়বদ্ধ নন।
কোন মন্তব্য বা পরামর্শ, আপনি আমার ওয়েবসাইটে এটা ছেড়ে স্বাগত জানাই। (Http://myappios.blogspot.tw)
সংস্করণ 4.3.4:
1. ড্রপবক্স থেকে স্টক / তহবিল তালিকা পেতে সমস্যা যে সমস্যা ঠিক করুন।
সংস্করণ 4.3.2:
1. সর্বশেষ সংস্করণে CoronaSDK আপডেট করুন।
সংস্করণ 4.3.1:
1. বাগ ফিক্স: স্টক স্ক্যান ত্রুটি সমস্যা।
সংস্করণ 4.3.0:
1. বাগ ফিক্স: গুগল সার্ভিস ইস্যু।
সংস্করণ 4.2.1:
1. বাগ সংশোধন করুন: ইয়াহু ফাইন্যান্স কখনও কখনও ভুল কুকি / ক্রাম ইস্যুটি পড়ে।
2. বাগ সংশোধন করুন: ইয়াহু মান সমস্যা পড়তে পারে না।
সংস্করণ 4.2.0:
1. বাগ সংশোধন করুন: গুগল পরিষেবাদিতে, সময়কালের দশমিক অংশ বাদ দেওয়া হয়েছিল।
সংস্করণ 4.1.2:
বৈশিষ্ট্যটি যোগ করুন যে যখন Yahoo কুকি মেয়াদউত্তীর্ণ হয়, স্বয়ংক্রিয়ভাবে কুকি পুনর্নবীকরণ করুন।
সংস্করণ 4.1.1:
1. কিছু ডিভাইস ঠিক করুন যা এখনও Yahoo ডেটা ইস্যু পেতে পারে না। \ N 2. সমস্যাটি সমাধান করুন: গ্রাফ দেখলে এবং জুম আপ হয়ে গেলে, স্ক্রোল করার সময় হ্যাঙ্গআপ।
সংস্করণ 4.1.0:
1. ইয়াহু ফিরে। এখন ইয়াহু ফাইনান্স নতুন API সমর্থন।
সংস্করণ 4.0.1:
1. বাগ ফিক্স: কিছু বাটন প্যাড সমস্যা অদৃশ্য হবে।
2. বাগ সংশোধন করুন: কিছু ক্ষেত্রে (স্ক্যানের মতো), Fetch গুগল ডেটা ইস্যু ব্যর্থ হবে।
সংস্করণ 4.0.0:
1. গুগল ফাইন্যান্স সাপোর্ট যোগ করুন। উল্লেখ্য যে সূচক ক্ষেত্র সূচী / বিনিময় ইনপুট প্রয়োজন। আপনি সমর্থিত বিনিময়ের জন্য (https://www.google.com/googlefinance/disclaimer/) পরিদর্শন করতে পারেন। এছাড়াও উল্লেখ করা হয়েছে যে বর্তমানে Google পরিষেবা সাপ্তাহিক / মাসিক সেটিংস এবং শেষ তারিখ সেটিংস সমর্থন করে না। আপনি সর্বদা শেষ ট্রেডিং দিন থেকে পেতে।


